J Biomed 2017; 2:1-7. doi:10.7150/jbm.17494 This volume Cite
Research Paper
A U-Shaped Relationship between Fasting Plasma Glucose and Severity of Sleep Apnea
Georgia Trakada1,4, George Giangou2, Paul Zarogoulidis1,3,4 ![]() , Lemonia Velentza1, Ioulia Antoniou2, Angeliki Konsta4, Anastasios Kallianos1, Asimina Mitrakou2
, Lemonia Velentza1, Ioulia Antoniou2, Angeliki Konsta4, Anastasios Kallianos1, Asimina Mitrakou2
1. Division of Pulmonology, Department of Clinical Therapeutics, National and Kapodistrian University of Athens School of Medicine, Alexandra Hospital, Athens, Greece.
2. Division of Diabetes and Metabolism Unit, Department of Clinical Therapeutics, National and Kapodistrian University of Athens School of Medicine, Alexandra Hospital, Athens, Greece.
3. Pulmonary Department, “G. Papanikolaou” General Hospital, Aristotle University of Thessaloniki, Thessaloniki, Greece
4. Sleep Research Unit, First Department of Psychiatry, National and Kapodistrian University of Athens School of Medicine, Eginition Hospital, Athens, Greece.
Received 2016-9-6; Accepted 2016-10-14; Published 2017-1-1
Abstract

Introduction: Current evidence supports an association between Obstructive Sleep Apnea Syndrome (OSAS) and insulin resistance and type 2 diabetes mellitus (DM 2). The relation between glycemic profile and severity of OSAS, in nondiabetic patients, is complex and still remains poorly understood.
Aim: To examine the potential correlation between sleep characteristics and glucose metabolism in nondiabetic patients, with OSAS.
Materials and Methods: Included were one hundred and fifty seven (157, 104 men and 53 women), with mean age 46.63±10.45years old and mean Body Mass Index (BMI) 31.47±5.8kg/m2, nondiabetic patients, recently diagnosed with OSAS, by full polysomnography. Patients were subdivided into four groups, according to their fasting plasma glucose (FPG) levels: group I: ≤75mg/dl (n=44), group II: 76-86mg/dl (n=37), group III: 87-96mg/dl (n=33) and group IV: ≥97mg/dl (n=43).
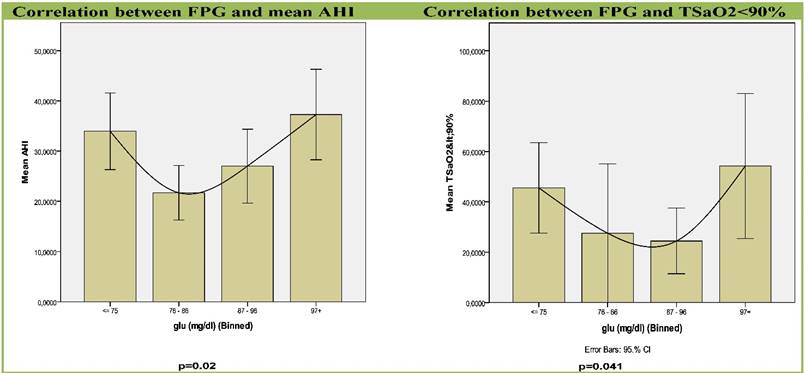
Results: Both, group I, with the lowest FPG and group IV, with the highest FPG were strongly associated with apnea-hypopnea index (AHI) (p=0.02), a widely accepted marker of the severity of OSAS, and with percentage of sleep time with saturation of hemoglobin with oxygen as measured by pulse oximetry (SpO2) < 90% (t < 90%), (p=0.041).
Conclusions: In conclusion, the severity of OSAS among nondiabetic patients correlates in a u-shaped relation with FPG. A compensatory, early rise in insulin secretion to maintain normal to low FPG could be an underlying mechanism that promotes the future development of DM 2, in OSAS. More studies are needed to assess whether early diagnosis and treatment of OSAS may reverse insulin resistance and prevent progress to diabetes.
Keywords: Metabolism, Glucose, Insulin resistance (IR), Obstructive, sleep apnea syndrome (OSAS), Apnea-Hypopnea Index, Hypoxemia
Introduction
OSAS is characterized by repeated episodes of complete or partial obstruction of the upper airway during sleep, associated with increased respiratory efforts, intermittent arterial oxygen desaturation, systemic and pulmonary arterial blood pressure alterations and sleep fragmentation. It is a common disorder, affecting approximately 3%-7% of adult men and 2%-5% of adult women in the general population and an important cause of morbidity and mortality.[1, 2]
Sleep apnea is recognized as a risk factor for insulin resistance (IR), independently of obesity, whereas, several studies have also documented bidirectional associations between OSAS and DM. Indeed, the prevalence of OSAS is estimated to be between 18% and 36% in patients with type 2 DM, whereas the prevalence of type 2 DM is approximately 30% in OSAS patients.[3-5] OSAS is a complex disorder involving intermittent hypoxia (IH), sleep fragmentation, low amounts of Slow Wave Sleep (SWS), and reduced total sleep time (TST). Sleep duration, quality, respiratory function during sleep, and circadian timing have all been linked to abnormal glucose metabolism.[6]
Ip and colleagues reported that markers of OSAS severity (Apnea Hypopnea Index [AHI] and minimum oxygen saturation [minSaO2]) were associated with insulin resistance[7], while Punjabi and colleagues found that sleep-disordered breathing (SDB) was associated with insulin resistance in mildly obese but otherwise healthy males from the general population.[8] Cross-sectional data from the Sleep Heart Health Study and the Wisconsin Sleep Cohort found similar results in population cohorts.[5, 9] However, the longitudinal data from the Wisconsin Cohort could not demonstrate a clear relationship between SDB and the subsequent development of DM.[5]
In patients that do not meet the criteria for the diagnosis of diabetes, the exact pathophysiological mechanism of the association between glycemic profile and severity of OSAS, remains unclear. In normal conditions, plasma glucose homeostasis is tightly controlled so that an elegant balance exists between glucose delivery and its utilization by peripheral tissues, in order for critical metabolic fueling to be constantly optimized and matched to demand.[10] Pamidi and colleagues demonstrated that in a population of very young, lean, and healthy men who are free of cardiometabolic disease, the presence of OSAS was associated with insulin resistance and a compensatory rise in insulin secretion to maintain normal glucose tolerance after ingestion of glucose load.[11] Another study, among nondiabetic and normotensive patients, proved that glucose and arterial pressure variability were associated with markers of OSAS severity (AHI, % sleep time with SaO2 <90%, minSaO2).[12] Also, in nondiabetic male OSAS patients without comorbidities, the severity of OSAS (evaluated by the number of respiratory cessation events, the indices of hypoxemia during sleep and the arousal index) was associated with increased fasting glucose and HbA1c levels.[13] Finally, 5 hours of intermittent hypoxia in healthy volunteers while awake, resulting in an average of 24.3 desaturation events per hour, equivalent to hypoxia in OSAS of moderate severity (15<AHI≤30), reduced insulin sensitivity and glucose effectiveness by 17 and 31%, respectively, without simultaneous increase in insulin secretion.[14] These results suggested that hypoxic stress may have an intrinsic adverse impact on glucose metabolism and diabetes risk.
Thus, the aim of the present study was to further clarify potential correlations of sleep characteristics with glucose metabolism in patients with OSAS and without a previous diagnosis of diabetes, whose glucose metabolism ranged from normal to pre-diabetic fasting glucose.
Subjects and Methods
Study group
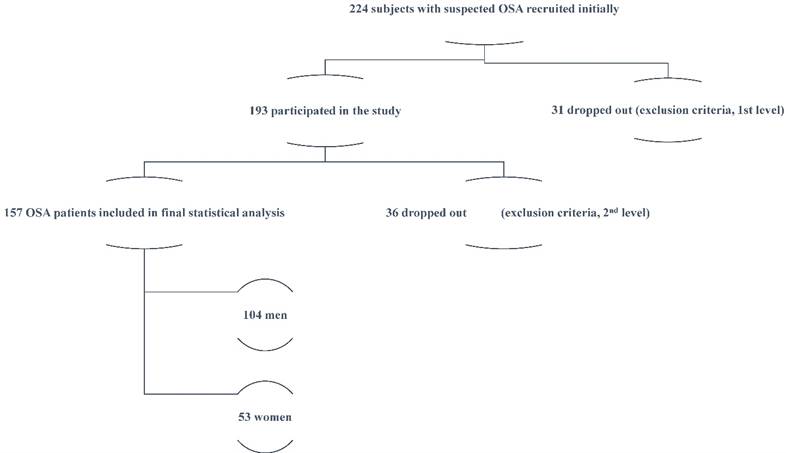
Two hundred twenty four (224) consecutive subjects, evaluated for suspected OSAS, between January and June 2009, comprised the study group. Each participant was evaluated by an experienced sleep physician. Exclusion criteria were: known diabetes mellitus or fasting glycaemia (fasting glucose ≥ 126 mg/dl or glycosylated hemoglobin [HbA1c]>6.5%) [15], cardiovascular or cerebrovascular disease, hypertension or other chronic disease, systemic medication use, as well as previous diagnosis and/or treatment for OSAS. The study was approved by the Institutional Ethics Committee and all subjects gave written informed consent.
Study protocol
All participants were examined with detailed medical history, full clinical examination and questionnaires about sleep habits. Thirty one (31) candidates dropped out because they had one or more of the exclusion criteria (1st level).
Each subject, of the remaining one hundred ninety three (193), underwent standard full night polysomnography (PSG) (Alice-4, Respironics, Pennsylvania, USA)). Sleep records were manually scored, according to standardized criteria.[16] Apnea was defined as the breathing cessation that exceeded 10 sec. In addition, hypopnea was defined as the reduction in airflow of approximately 30% which was associated with a reduction of 3% or more of oxyhemoglobin saturation. AHI was defined as the total number of apneas and hypopneas per hour of electroencephalographic sleep and moderate to severe OSAS was defined as an AHI of ≥15/hour.[17] Fasting venous blood sample was collected the day after PSG, between 8 and 9 AM.
Thirty six (36) more participants were dropped out at this 2nd level because they had either a normal PSG (AHI<5), and/or episodes of central apneas >50% of total events, and/or fasting glycaemia (fasting glucose ≥126 mg/dl or glycosylated hemoglobin [HbA1c] ≥ 6.5%). The study protocol is presented in Figure 1.
Blood assays
Fasting venous blood samples were collected the day after PSG, between 8 and 9 AM, after an overnight fast to measure levels of glucose, total cholesterol, HDL, low density lipoprotein (LDL), triglycerides, and uric acid. Biochemical analyses were performed in an ILAB 600 analyzer (Biochem, Tokyo, Japan) with enzymatic method for glucose (mg/dL).
Statistical analysis
A total of 157 OSAS patients were included in the statistical analysis. Analysis was performed with SPSS for Windows, version 18.0 (SPSS, Chicago, IL, USA). Analysis of variance (ANOVA) with post-hoc Bonferroni corrections and polynomial contrasts were performed in order to assess differences among groups. Chi-square test was used to detect differences among-group in dichotomous variables. Analysis of co-variance was applied to adjust for confounding factors in regard to the relationships between glucose and apnea-related characteristics. Statistical significance was defined at a level of 5% (p ≤ 0.05).
Results
We examined 104 men and 53 women with mean age 46.63±10.45 years old (from 22-69 years old) and mean Body Mass Index (BMI) 31.47±5.8 kg/m2 (from 20.9-59.0 Kg/m2). Sleep and metabolic characteristics of our study population are presented in Table 1.
Subjects were divided into 4 groups based on the cutoff value of 75, 86, 96 mg/dl, in FPG level as follow: Group I with FPG≤75mg/dl (n=44, mean BMI 29.26±3.06 kg/m2), Group II with FPG 76-86 mg/dl (n=37, mean BMI 30.48±0.72kg/m2), Group III with FPG 87-96mg/dl (n=33, mean BMI 30.82±5.64kg/m2), Group IV with FPG ≥97mg/dl (n=43, mean BMI 35.08±7.42kg/m2). There was no statistically significant difference in age and BMI within the groups.
A correlation like U-Shape curve between FPG levels and apnea-related parameters was revealed (Table 2, Figures 2,3). Groups with the lowest FPG ≤75 mg/dl (n=44) as well as the highest FPG ≥97 mg/dl (n=43) were associated with higher AHI (p=0.02) and sleep time with SaO2<90% (TSaO2<90) (p=0.041). Glucose groups significantly differed by ANOVA (F=3.394, p=0.02) and by further analysis with quadratic contrasts (p=0.004) and the correlation remained significant even after adjustment for age and BMI.
Study protocol.
Graphs for correlation between apnea-related parameters and FPG in four sub-groups. Each column represents fasting plasma glucose groups. Abbreviations: AHI, Apnea Hypopnea Index; SD, standard deviation; TSaO2<90%, sleep time with SaO2< 90%.
Graphs for correlation of AHI and metabolic factors. Dots are the values of metabolic factors (HDL, LDL, Chol and tgl) of each object. The lines represent the variability of metabolic factors as the value of AHI increases. There was no statistically significant relationship between LDL (p=0.188), CHOL (p=0.464), tgl (p=0.252) and AHI. Only HDL was inversely correlated with AHI (p=0.022).
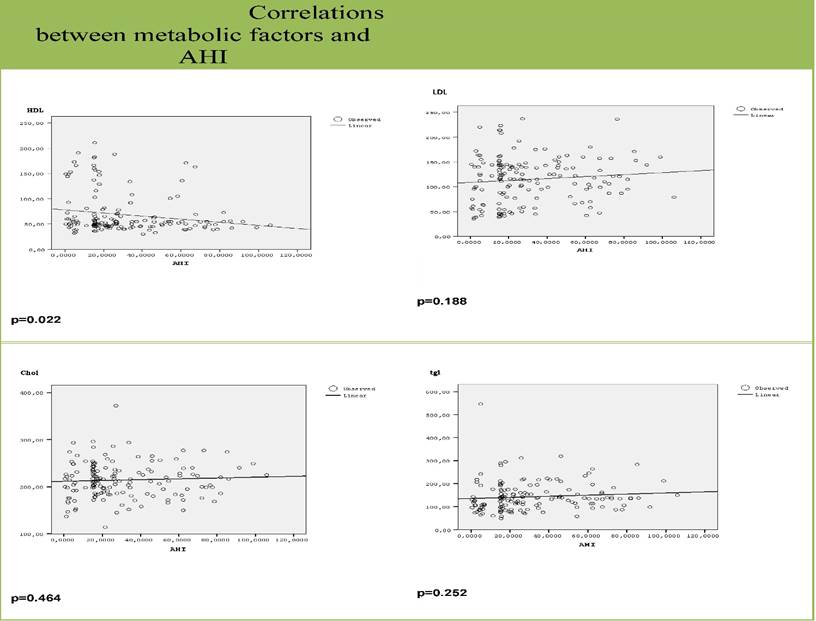
Finally, HDL was inversely correlated with AHI (p=0.022). This correlation also remained significant even after adjustment for age and BMI (p=0.014). There was no correlation with any other metabolic factors (figure 3).
Sleep and metabolic characteristics of OSA patients.
| Parameter | Mean ± SD | Range | Std. Error |
|---|---|---|---|
| Age (years) | 46.63±10.45 | 22-69 | 2.1 |
| BMI (kg/m2) | 31.47±5.8 | 20.9-59 | 1.4 |
| AHI (events/hour) | 30.51±5.8 | 15-106 | 1.94 |
| Average SaO2 (%) | 88.48±6.4 | 59.5-97 | 0.51 |
| Minimum SaO2 (%) | 85.23±8.6 | 47.0-96 | 0.69 |
| TSa02<90 (%) | 39.23±71.5 | 0.0-492.4 | 5.78 |
| Fasting Plasma Glucose (mg/dl) | 86.82±18.8 | 45.0-126 | 1.49 |
| Total Cholesterol (mg/dl) | 214.02±36.44 | 114.0-372 | 2.90 |
| HDL-Cholesterol | 68.66±40.72 | 30.0-211 | 3.25 |
| LDL-cholesterol | 114.71±45.54 | 35.0-237 | 3.66 |
| Triglycerides | 143.38±63.19 | 49.0-547 | 5.04 |
Abbreviations: AHI, Apnea Hypopnea Index; OSA, obstructive sleep apnea; SaO2, saturation of hemoglobin with oxygen as measured by pulse oximetry; HDL, high-density lipoprotein; LDL, low-density lipoprotein; SD, standard deviation.
Metabolic and sleep characteristics of different groups.
| Group (n) | BMI (kg/m2) | AHI (events/hour) | TSa02<90 (%) |
|---|---|---|---|
| I (44) | 29.26±3.06 | 34.6±3.3 | 32.9±51.9 |
| II (37) | 30.48±0.72 | 26.9±4.9 | 24.1±69.12 |
| III (33) | 30.82±5.64 | 25.2±5,4 | 22.8±61.7 |
| IV (43) | 35.08±7.42 | 32.4±2,13 | 37.9±55.9 |
Discussion
The present study examined the potential correlation of sleep characteristics with glucose metabolism in nondiabetic patients with newly diagnosed OSAS. According to our results, in nondiabetic OSAS patients without comorbidities, the severity of OSAS (evaluated by the number of respiratory cessation events and the indices of hypoxemia during sleep) is associated with the lowest and the highest FPG, in a u-shaped relation, independently of obesity, as expressed by BMI.
A growing evidence from epidemiological and clinic-based studies suggests an independent relationship between sleep apnea and abnormal glucose tolerance.[7-9, 18, 19] Insulin resistance, has been implicated in the pathogenesis of a metabolic syndrome known as “insulin-resistance syndrome”, which is generally accepted to comprise hyperinsulinemia, glucose intolerance, dyslipidemia, central obesity and hypertension.[20] On the other hand, low fasting glucose levels have been associated with cachexia in people with cancer or other degenerative diseases.[21] In these populations, individuals have a very low BMI, ectopic fat accumulation and extreme insulin resistance. Thus, one could hypothesize that insulin resistance may be associated with reasons others than body weight and/or BMI.
In our population, the lowest and the highest FPG correlated with the severity of OSAS, independently of BMI. This finding is consistent with an expanding evidence base that supports an independent link between OSAS and insulin resistance, different from obesity. Clinic-based and case control studies from North America, Asia and Europe have suggested that the presence and severity of OSAS is independently associated with insulin resistance.[22] An AHI ≥5 was associated with an increased risk of glucose intolerance independently of the effect of obesity, in 150 middle-aged, overweight or mildly obese men.[8] Among 270 non-diabetic subjects, attending a Hong Kong sleep clinic, homeostasis model assessment of insulin resistance (HOMA-IR) was higher in those with OSAS and increased with increasing OSAS severity, in both obese and non-obese subjects.[7] Even in morbidity obese patients, the severity of sleep disordered breathing predicted an elevated HOMA-IR in 90 patients recruited from a bariatric clinic[23], while increasing OSAS severity was associated with decreased insulin sensitivity in a cohort of 400 non-diabetic Swedish women.[24] In an evaluation of the relationship of HbA1c levels with indices of OSAS severity in subjects without diabetes, attending Greek and French sleep laboratories [13, 25], multivariate regression analysis showed an association between increased HbA1c levels and OSAS severity, in men and most marked in patients with an AHI ≥50, respectively. Most recently, a similar analysis of 5,294 non-diabetic participants in the pan-European ESADA study, showed a dose dependent relationship between glycemic health and severity of sleep disordered breathing, with a significantly higher adjusted HbA1c level in highest AHI quartile than in the lowest.[26] Furthermore, in lean, young and otherwise healthy and free of cardiometabolic disease men, the presence of OSAS was associated with 27% lower insulin sensitivity accompanied by a 37% higher total insulin secretion after ingestion of glucose load compared with control men of similar age, BMI, ethnicity-based diabetes risk, family history of diabetes, exercise habits, blood pressure, and fasting lipids levels.[11]
Although the association between OSAS and insulin resistance is well documented, the exact, underlying, pathophysiological mechanism still not fully understood. Dysregulation of the hypothalamic-pituitary-adrenal (HPA) axis, inflammation and hypersecretion of adipocyte-derived hormones due to repetitive, short periods of asphyxia and hypoxemia, intermittent, nocturnal hypoxia and sleep deprivation have all been implicated in the association between OSAS and insulin resistance.
Several studies proved that indices of hypoxemia had the most robust relationship with impaired glucose metabolism. Experiments in animal models, which provide a unique opportunity to study the effects of specific exposures, have shown that intermittent hypoxemia can decrease insulin sensitivity and induce glucose intolerance.[27, 28] There is only one experimental study in 13 healthy volunteers that examined the impact of intermittent hypoxemia on glucose metabolism, while awake.[14] In this study, short-term episodic hypoxia during daytime, decreased insulin sensitivity and glucose effectiveness, without a commensurate increase in insulin secretion. Intermittent hypoxia was also associated with a shift in sympathovagal balance toward an increase in sympathetic nervous system activity. According to authors, intermittent hypoxemia was a central mechanism responsible for metabolic dysfunction, whereas sympathetic nervous system was a putative mediator.
Intermittent hypoxia is the hallmark of OSAS. In terms of metabolism, hypoxic stress in obstructive sleep apnea has been shown to increase the predisposition for metabolic dysfunction by impairing insulin sensitivity, glucose effectiveness, and insulin secretion.[29] First in 2002, two independent groups simultaneously published convergent findings associating hypoxia of sleep apnea with altered glucose metabolism.[7, 8] The first study utilized a clinic sample of 270 patients from Hong Kong and reported that the AHI and minimum oxygen saturation during sleep were independent correlates of insulin resistance.[7] The second study utilized a community sample of 150 healthy men from the United States and reported that the AHI and the degree of nocturnal desaturation were associated with glucose intolerance and insulin resistance independent of obesity.[8] In another study, in 31 nondiabetic, male OSAS patients, without comorbidities, hypoxemia during sleep was associated with increased fasting glucose and HbA1c levels.[13] Finally, in the large, multicenter Sleep Heart Health Study [9], in a community sample of 2,656 subjects, AHI and average oxygen saturation during sleep were associated with elevated fasting and 2-h glucose levels during an oral glucose tolerance test.
The exact relationship between OSAS and dyslipidaemia remains also conflicting, with a recent study mapping a nonlinear, multistage relationship between the severity of OSAS and the risk of dyslipidaemia.[30] In our study, severity of OSAS was inversely correlated with HDL values, low values of which are a strong cardiovascular risk factor.
A limitation of our study is the lack of measurements of insulin levels which were not necessary at the time the study was designed.
In the present study, we demonstrated that in nondiabetic OSAS patients, without comorbidities, the lowest and the highest fasting plasma glucose levels, within normal and prediabetes levels, correlated similarly with the higher AHI and the higher percent of sleep time spent with SaO2<90%, regardless of obesity as expressed by BMI. The identification of a non-linear and non-monotonic pattern between the risk of abnormal glucose metabolism and the severity of OSAS, allowed us to unravel the complex nature of the interactions of multiple risk factors Our findings also, triggered us to design new studies to clarify the relationship of U shaped relation between fasting plasma glucose levels and severity of sleep apnea.
Ethical approval
All procedures performed in studies involving human participants were in accordance with the ethical standards of the institutional and/or national research committee and with the 1964 Helsinki declaration and its later amendments or comparable ethical standards.
Informed consent
Informed consent was obtained from all individual participants included in the study.
Competing Interests
The authors have declared that no competing interest exists.
References
1. Punjabi NM. The epidemiology of adult obstructive sleep apnea. Proceedings of the American Thoracic Society. 2008;5:136-43 doi:10.1513/pats.200709-155MG
2. McNicholas WT, Bonsigore MR, Management Committee of ECAB. Sleep apnoea as an independent risk factor for cardiovascular disease: current evidence, basic mechanisms and research priorities. The European respiratory journal. 2007;29:156-78 doi:10.1183/09031936.00027406
3. Tasali E, Mokhlesi B, Van Cauter E. Obstructive sleep apnea and type 2 diabetes: interacting epidemics. Chest. 2008;133:496-506 doi:10.1378/chest.07-0828
4. West SD, Nicoll DJ, Stradling JR. Prevalence of obstructive sleep apnoea in men with type 2 diabetes. Thorax. 2006;61:945-50 doi:10.1136/thx.2005.057745
5. Reichmuth KJ, Austin D, Skatrud JB, Young T. Association of sleep apnea and type II diabetes: a population-based study. American journal of respiratory and critical care medicine. 2005;172:1590-5 doi:10.1164/rccm.200504-637OC
6. Reutrakul S, Van Cauter E. Interactions between sleep, circadian function, and glucose metabolism: implications for risk and severity of diabetes. Annals of the New York Academy of Sciences. 2014;1311:151-73 doi:10.1111/nyas.12355
7. Ip MS, Lam B, Ng MM, Lam WK, Tsang KW, Lam KS. Obstructive sleep apnea is independently associated with insulin resistance. American journal of respiratory and critical care medicine. 2002;165:670-6 doi:10.1164/ajrccm.165.5.2103001
8. Punjabi NM, Sorkin JD, Katzel LI, Goldberg AP, Schwartz AR, Smith PL. Sleep-disordered breathing and insulin resistance in middle-aged and overweight men. American journal of respiratory and critical care medicine. 2002;165:677-82 doi:10.1164/ajrccm.165.5.2104087
9. Punjabi NM, Shahar E, Redline S, Gottlieb DJ, Givelber R, Resnick HE. et al. Sleep-disordered breathing, glucose intolerance, and insulin resistance: the Sleep Heart Health Study. American journal of epidemiology. 2004;160:521-30 doi:10.1093/aje/kwh261
10. Mitrakou A. Pathogenesis of hyperglycaemia in type 2 diabetes. Diabetes, obesity & metabolism. 2002;4:249-54
11. Pamidi S, Wroblewski K, Broussard J, Day A, Hanlon EC, Abraham V. et al. Obstructive sleep apnea in young lean men: impact on insulin sensitivity and secretion. Diabetes care. 2012;35:2384-9 doi:10.2337/dc12-0841
12. Kallianos A, Trakada G, Papaioannou T, Nikolopouloss I, Mitrakou A, Manios E. et al. Glucose and arterial blood pressure variability in Obstructive Sleep Apnea Syndrome. European review for medical and pharmacological sciences. 2013;17:1932-7
13. Papanas N, Steiropoulos P, Nena E, Tzouvelekis A, Maltezos E, Trakada G. et al. HbA1c is associated with severity of obstructive sleep apnea hypopnea syndrome in nondiabetic men. Vascular health and risk management. 2009;5:751-6
14. Louis M, Punjabi NM. Effects of acute intermittent hypoxia on glucose metabolism in awake healthy volunteers. Journal of applied physiology. 2009;106:1538-44 doi:10.1152/japplphysiol.91523.2008
15. Kilpatrick ES, Bloomgarden ZT, Zimmet PZ. International Expert Committee report on the role of the A1C assay in the diagnosis of diabetes: response to the International Expert Committee. Diabetes care. 2009;32:e159 author reply e60. doi:10.2337/dc09-1231
16. Duchna HW. [Sleep-related breathing disorders-a second edition of the International Classification of Sleep Disorders (ICSD-2) of the American Academy of Sleep Medicine (AASM)]. Pneumologie. 2006;60:568-75 doi:10.1055/s-2006-944248
17. Schulz H. Phasic or transient? Comment on the terminology of the AASM manual for the scoring of sleep and associated events. Journal of clinical sleep medicine: JCSM: official publication of the American Academy of Sleep Medicine. 2007;3:752
18. Vgontzas AN, Papanicolaou DA, Bixler EO, Hopper K, Lotsikas A, Lin HM. et al. Sleep apnea and daytime sleepiness and fatigue: relation to visceral obesity, insulin resistance, and hypercytokinemia. The Journal of clinical endocrinology and metabolism. 2000;85:1151-8 doi:10.1210/jcem.85.3.6484
19. Trakada G, Chrousos G, Pejovic S, Vgontzas A. Sleep Apnea and its association with the Stress System, Inflammation, Insulin Resistance and Visceral Obesity. Sleep medicine clinics. 2007;2:251-61 doi:10.1016/j.jsmc.2007.04.003
20. Reaven GM. Banting lecture 1988. Role of insulin resistance in human disease. Diabetes. 1988;37:1595-607
21. Porporato PE. Understanding cachexia as a cancer metabolism syndrome. Oncogenesis. 2016;5:e200. doi:10.1038/oncsis.2016.3
22. Kent BD, McNicholas WT, Ryan S. Insulin resistance, glucose intolerance and diabetes mellitus in obstructive sleep apnoea. Journal of thoracic disease. 2015;7:1343-57 doi:10.3978/j.issn.2072-1439.2015.08.11
23. Polotsky VY, Patil SP, Savransky V, Laffan A, Fonti S, Frame LA. et al. Obstructive sleep apnea, insulin resistance, and steatohepatitis in severe obesity. American journal of respiratory and critical care medicine. 2009;179:228-34 doi:10.1164/rccm.200804-608OC
24. Theorell-Haglow J, Berne C, Janson C, Lindberg E. Obstructive sleep apnoea is associated with decreased insulin sensitivity in females. The European respiratory journal. 2008;31:1054-60 doi:10.1183/09031936.00074907
25. Priou P, Le Vaillant M, Meslier N, Chollet S, Masson P, Humeau MP. et al. Independent association between obstructive sleep apnea severity and glycated hemoglobin in adults without diabetes. Diabetes care. 2012;35:1902-6 doi:10.2337/dc11-2538
26. Kent BD, Grote L, Bonsignore MR, Saaresranta T, Verbraecken J, Levy P. et al. Sleep apnoea severity independently predicts glycaemic health in nondiabetic subjects: the ESADA study. The European respiratory journal. 2014;44:130-9 doi:10.1183/09031936.00162713
27. Iiyori N, Alonso LC, Li J, Sanders MH, Garcia-Ocana A, O'Doherty RM. et al. Intermittent hypoxia causes insulin resistance in lean mice independent of autonomic activity. American journal of respiratory and critical care medicine. 2007;175:851-7 doi:10.1164/rccm.200610-1527OC
28. Yokoe T, Alonso LC, Romano LC, Rosa TC, O'Doherty RM, Garcia-Ocana A. et al. Intermittent hypoxia reverses the diurnal glucose rhythm and causes pancreatic beta-cell replication in mice. The Journal of physiology. 2008;586:899-911 doi:10.1113/jphysiol.2007.143586
29. Stamatakis KA, Punjabi NM. Effects of sleep fragmentation on glucose metabolism in normal subjects. Chest. 2010;137:95-101 doi:10.1378/chest.09-0791
30. Guan J, Yi H, Zou J, Meng L, Tang X, Zhu H. et al. Distinct severity stages of obstructive sleep apnoea are correlated with unique dyslipidaemia: large-scale observational study. Thorax. 2016;71:347-55 doi:10.1136/thoraxjnl-2015-207403
Author contact
![]() Corresponding author: Paul Zarogoulidis, M.D, Ph. D. Pulmonary Department-Oncology Unit, “G. Papanikolaou” General Hospital, Aristotle University of Thessaloniki, Thessaloniki, Greece. Fax: 00302310992424 Mobile: 00306977271974 E-mail: pzarogcom
Corresponding author: Paul Zarogoulidis, M.D, Ph. D. Pulmonary Department-Oncology Unit, “G. Papanikolaou” General Hospital, Aristotle University of Thessaloniki, Thessaloniki, Greece. Fax: 00302310992424 Mobile: 00306977271974 E-mail: pzarogcom